Cohorts Reports
Unity LevelPlay provides you with comprehensive reports on user cohorts.
A cohort is a group of users that perform a certain sequence of events within a particular timeframe. A cohort on Unity LevelPlay represents a collection of users that installed your app, and triggered an app launch on the same day.
The Cohort Reports on Unity LevelPlay track metrics such as retention, revenue per user, and user engagement rate over time from the moment the user started using your app within the date range defined. The report is based on the user’s “age” as a user of your app and is not calendric. This allows you to analyze how certain groups of users engage with your app as time progresses, so you can gain a more complete picture of the overall lifecycle of your mobile apps.
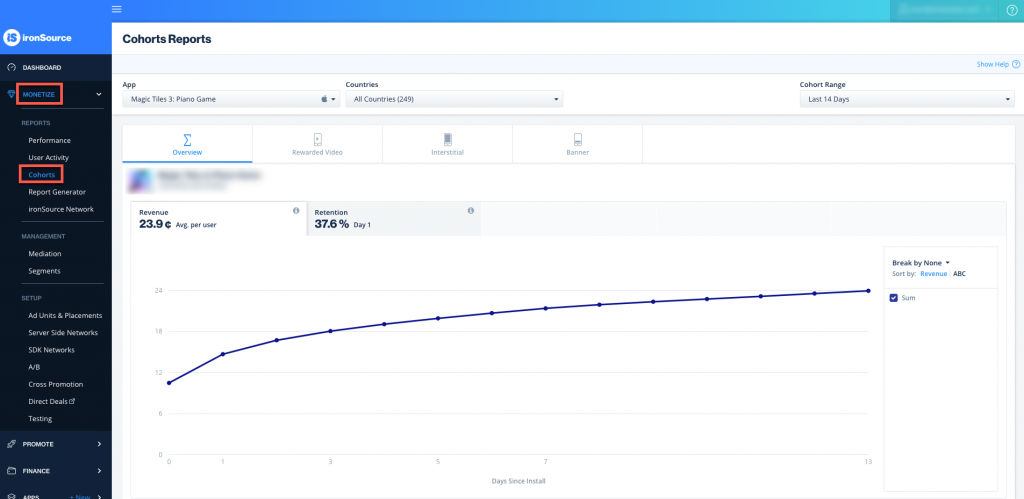
Step 1. Navigate to Cohorts
Log in to the ironSource platform and on the left menu bar, navigate to Monetize ➣ Reports ➣ Cohorts
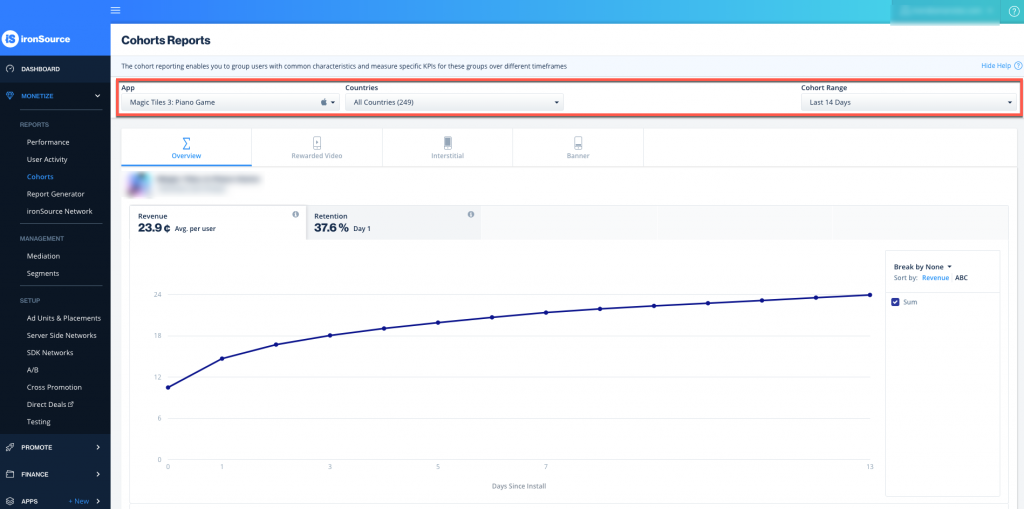
Step 2. Configure Your Report
To build your Cohorts report, apply the following:
Filters
- App: Select the app you want to track user cohorts from.
- Countries: Select the country you want to filter the data for
- Cohort Range: Define the time span in which to analyze users based on when they installed your app and triggered an app launch. You will thus be able to track user activity and how users develop over time from the day they installed your app within this timeframe.
Breakdowns
- You can choose to break down the reports by Ad Unit, Ad Source, Country, ATT, IDFA, AB test, Cohort date and Segment. If you don’t choose a breakdown (Break by None), the graph will simply portray aggregated data.
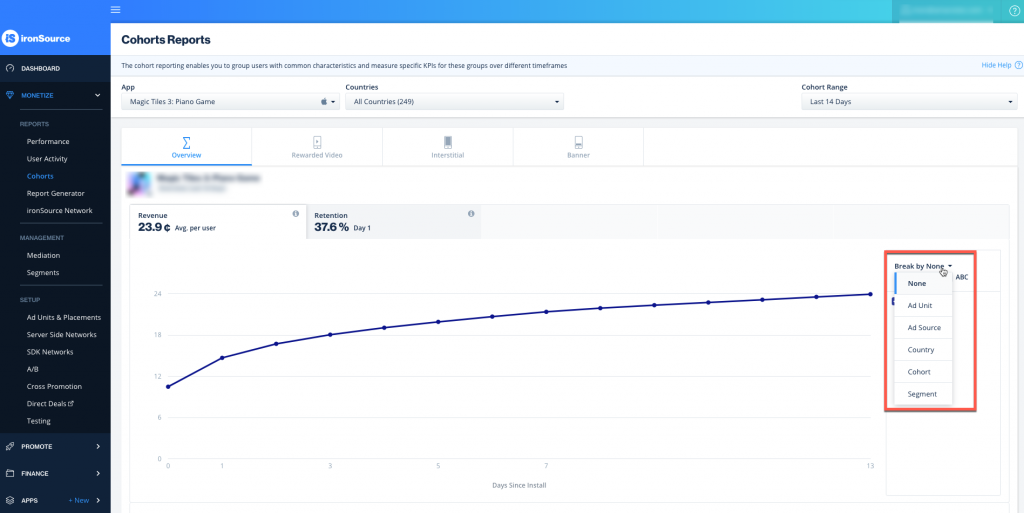
- If you break down by Ad Unit, Ad Source, Country, Cohort date or segment, you can also choose to sort the data in the graph by Revenue or ABC. This simply means the graph will be arranged in order of highest revenues or alphabetically.
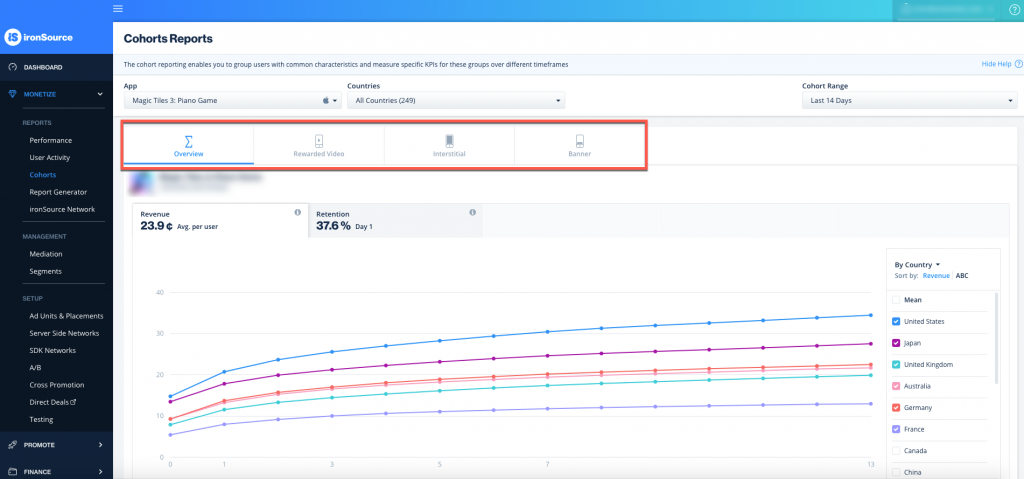
Tabs
You can examine your reports for all ad units in the Overview tab or for to view each ad unit separately simply navigate between the tabs.
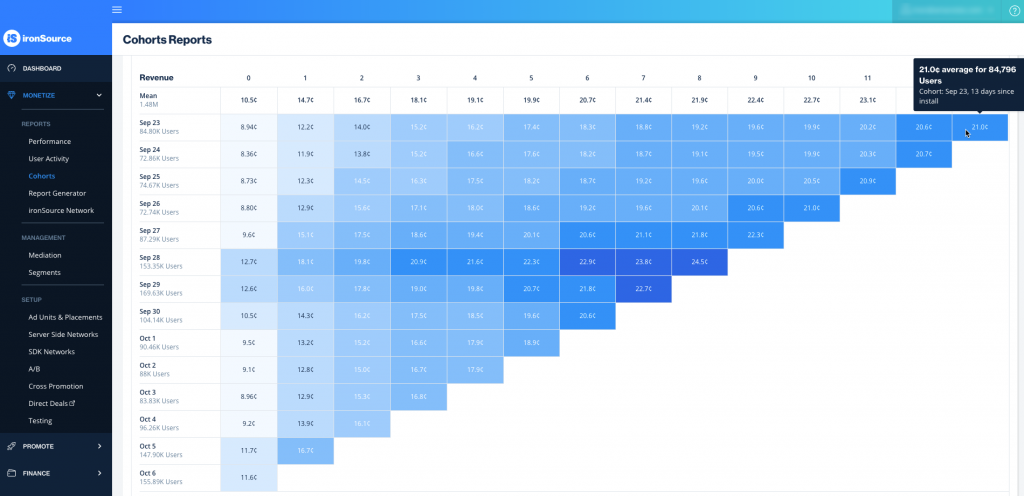
Step 3. Browse Your Metrics
Cohorts help you track your users’ engagement with your app based on when they started interacting with your app and can also aid in understanding how these engagements change following changes made in your app, such as ad implementation.
Supported Metrics on the Cohorts Reports Dashboard
The cohort metrics strive to ensure you can compare apples to apples. When you select a cohort range, the metrics will portray data of all new users within that time frame, and calculations are staggered by their present day-after-install. For example, if you look at a cohort’s engagement rate for day 2 after install on a Tuesday, no users who installed the app on Monday (the previous day) will be included as they have not yet completed their second day after installing your app.
Basic Cohort Terminology
| User | This cohort member: installed your app triggered an app launch on the day of the install |
| Active User |
This cohort member:
installed your app triggered an app launch on the day of the install returned to your app following install day |
| Engaged User |
This cohort member:
installed your app triggered an app launch on the day of the install returned to your app following install day engaged with one or more ads |
Overview Metrics
Retention: The average percentage of users that return to your app after the first app launch within the defined cohort range. The KPI portrayed is the average retention from Day 1.
Calculation: Daily Active Users Since Install Day divided by Daily Active Users on Install Day
Revenue per User: The average daily revenue generated by an active user. The KPI portrayed is the average revenue generated from an active user within the defined cohort range.
Rewarded Video, Interstitial & Banner Metrics
Revenue per User: The revenue generated per active user. The KPI portrayed is the average revenue per active user in the defined cohort range.
Engagement Rate: The rate at which active users converted to engaged users. The KPI portrays the average percentage of user engagement within the defined cohort. The Impressions per User: The distribution of ad impressions over the users. The KPI portrays the sum of average impressions for a user within the defined cohort range. Revenue per Engaged User: The revenue generated per engaged user. The KPI portrayed is the average revenue per an engaged user in the defined cohort range. Impressions per Engaged User: The amount of impressions an engaged user triggers. The KPI portrayed is the average impressions generated by an engaged user within the defined cohort range.
Calculation: total number of engaged users divided by the total number of active users
Calculation: Total impressions divided by total users
Calculation: The total of ad impressions divided by the total number of engaged users