Analysis Reports
Our Analysis Reports provide more granular data that will help you make decisions to improve your campaign performance. Add as many breakdowns, metrics, and filters as you’d like for your chosen timeframe to get the desired results.
Step 1. Navigate to Promote Reports
To view the Analysis Reports go to Promote → Reports → Analysis
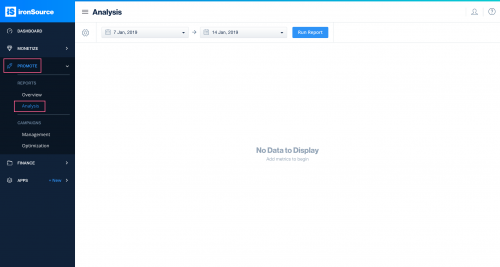
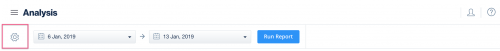
Select the desired date range, and use the gear icon to select your date granularity, breakdowns, filters, and metrics. You will find more granular breakdowns and filters than in the Overview Reports page.
These are the available granularities:
- Day
- Week
- Month
- None
These are the available Breakdowns:
- Title
- OS
- Campaign ID
- Campaign Name
- Creative id*
- Creative name*
- Country
- Application id
- Application Name
- Device Type
- Ad Unit
*Note that you will only be able to view creative data for CPI campaigns that have been set up in the platform.
Step 3: Define Your Metrics
Select as many metrics as you’d like to help you perform detailed analysis of your campaigns. Choose between a number of basic, calculated, and cohort metrics. The available metrics are:
Basic metrics:
- Impressions: Total number of times the ad is shown.
- Clicks: Total number of times users clicked on the ad.
- Completions: Total number of times users completed the desired action of the campaign. For example, the completion for CPI campaigns is the install, and the completion for CPE campaigns is the event completion.
- Installs: Total number of new app installs received (the user must download and open the app).
- Spend: Total campaign spend.
Calculated metrics:
- CTR (Click Through Rate): Clicks divided by impressions.
- CVR (Conversion Rate): Completions divided by clicks.
- IPM: The number of completions generated per one thousand impressions. This is the combination of CTR & CVR, and represents the overall creative effectiveness and users desire to install your app. Calculation: Installs/Impressions*1000
- eCPM: The spend per one thousand impressions. This represents the marketability of your campaign within the ironSource network. Calculation: Spend/Impressions*1000
- eCPI (Effective Cost Per Install): Spend divided by installs. This represents the average CPI for the measured timeframe.
- eCPA (Effective Cost Per Action): Spend divided by completions. This represents the average CPA for the measured timeframe.
Cohort metrics:
- Ad revenue: The amount of revenue generated from users viewing ads in your app.
- IAP revenue: The amount of revenue generated from users making purchases in your app.
- Total revenue: The sum of Ad revenue and IAP revenue.
- ARPU: The average revenue generated per user within the defined cohort range. Calculation: Total Revenue from Day 0 through Day X divided by installs on Day 0.
- ROAS (Return On Ad Spend): The percentage of total revenue generated within the defined cohort range out of total campaign spend. Calculation: Total revenue from Day 0 through Day X divided by the total spend on day 0.
- Unique Purchasers: Installed users who have also completed an in-app purchase within the defined cohort range.
- Purchasers rate: The percentage of new users who have made an in-app purchase within the defined cohort range. Calculation: Unique Purchases from Day 0 – Day X divided by installs on Day 0.
- Retention: The percentage of users that return to your app on a specific day after their first app launch within the defined cohort range. Calculation: Retained users on day X divided by the number of new installs on day 0.
Cohort: Defines the time span in which to analyze users based on when they installed your app and triggered an app launch. D0 is considered the first day the user opened the app. You will thus be able to track user activity and how users develop over time from the day they installed your app within this timeframe. We currently support the following cohort ages – D1, D3, D7, D14, D30.
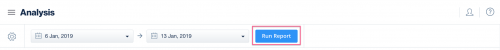
Once you are finished configuring the metrics and choosing a date range, select ‘Run Report’ and your report will be generated accordingly.
Step 4: Export Your Data
![]()
Once the report is generated, click on ‘Export Report’ if you’d like to save it or perform further analysis with the data.