User Activity Reports
The User Activity Reports page provides a centralized space to review high level aggregated information about app usage and ad engagement trends among users. Publishers, AMs, and analysts can compare this data to benchmarks and optimize an app’s monetization strategy. The data here is most valuable when looking at all of the networks, combined.
The User Activity data is only complete and useful if Unity LevelPlay is the mediating partner. Without mediation, this tab will not accurately reflect:
- DAU
- DEU
- Engagement
- Impressions/ DEU (Usage)
- Impressions / DAU
- Sessions/DAU
User Activity insights are available for rewarded video, interstitial, banner/MREC, and offerwall ad units.
Where to find User Activity Reports
To view your User Activity Reports, go to Monetize ➣ Reports ➣ User Activity
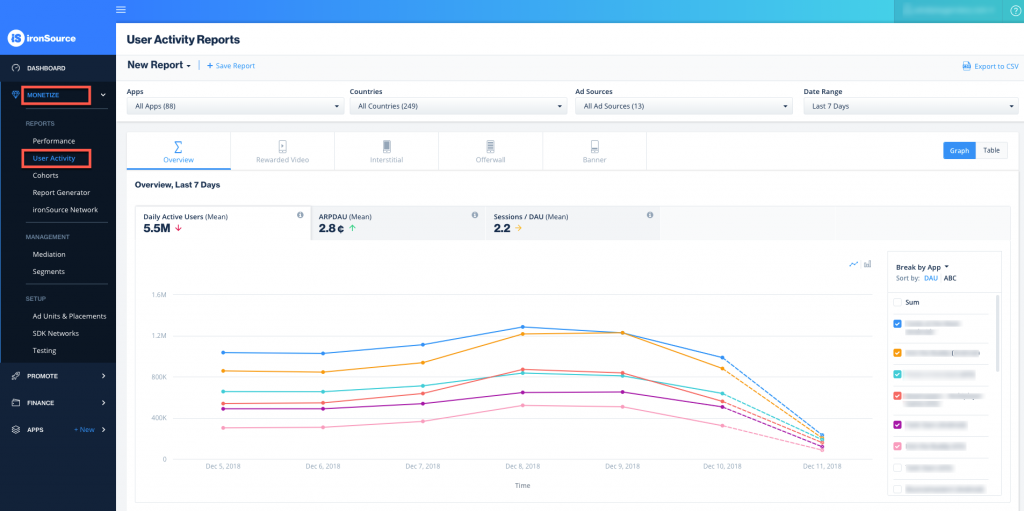
Overview
The Overview offers a high level snapshot of Daily Active Users, ARPDAU, and Sessions per DAU. You have the ability to filter to specific applications, countries, Ad Sources, A/B groups, and adjust your timeframe so you can review performance trends over a given period of time.
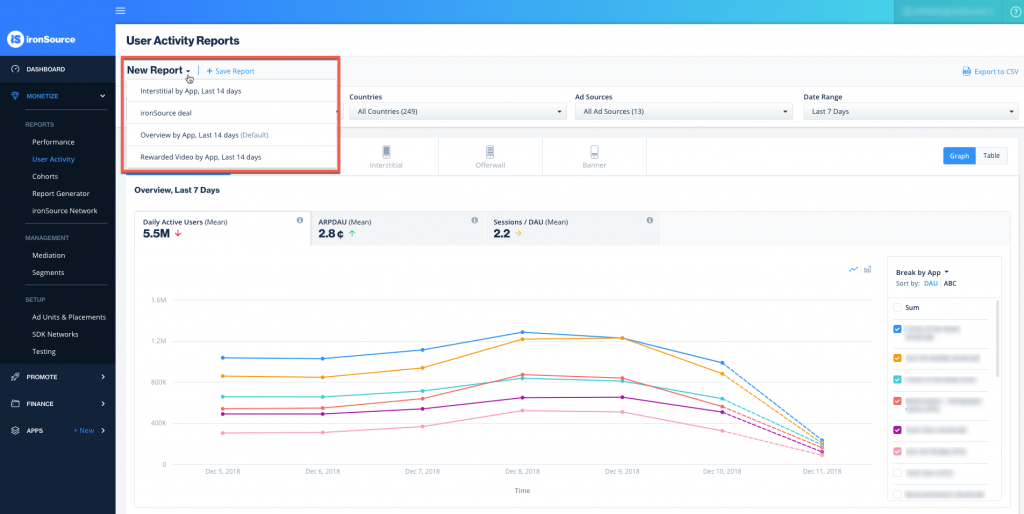
If you have saved reports in the past, you can view them by clicking the arrow next to New Report.
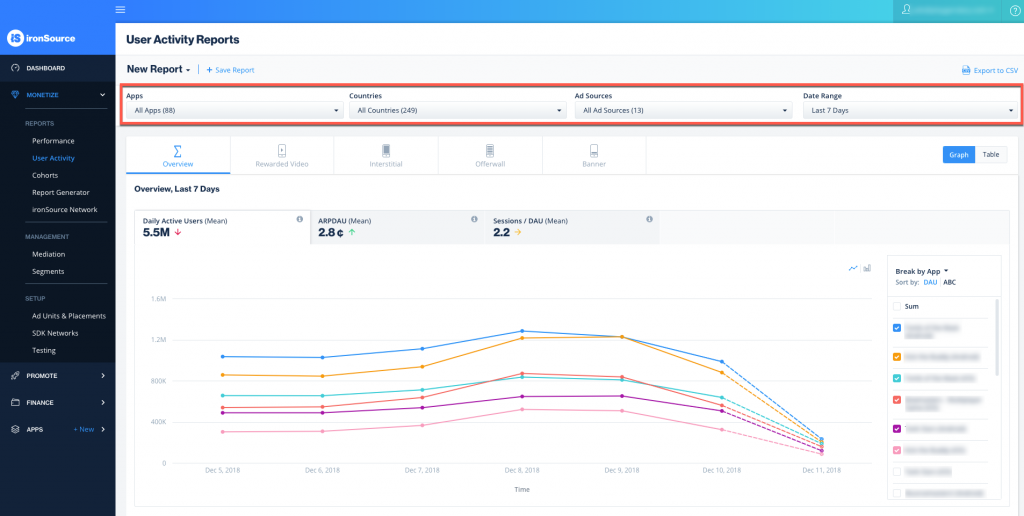
Filters
Filters make it easier to find specific results and separate the rest of the data to simplify your report. With a diverse portfolio of multiple game genres spread between different countries, zooming in with filters allows you to review one title or geo at a time, which can be the key to understanding performance and building a plan to optimize a title.
- Apps – View reports only for specific apps, to isolate the data for certain apps or per app you monetize with ironSource. You can choose to include or exclude certain apps
- Countries – View your apps’ performance based on geo and demographic
- Ad Sources – Understand the performance of a specific network. You can choose to include or exclude certain ad sources
- Date Range – Select any pre-defined range or create a custom date range
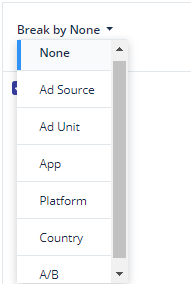
Breakdowns
Use breakdowns to create different views of your data based on the selections you’ve chosen in the filters section. Customize the view even further by selecting how the list is sorted, as well as the checkboxes which control what you see in the graph.
- Ad source
- Ad source instance
- App
- Country
- Placement
- Segment
- Platform
- ATT *
- IDFA
- GAID
*Analyze the impact of ATT permissions in your user activity report with a breakdown by ATT status. This is relevant only for iOS apps and is available with ironSource SDK 7.1.0+
ATT status is broken down into 4 values:
- 0 – Not Determined – No ATT dialog was presented to the user, therefore the user made no active choice about sharing their IDFA. This status also includes user devices where LAT was turned on in earlier iOS versions. (IDFA shared/not shared accordingly)
- 1 – Restricted – Access to IDFA sharing is blocked without any end-user input (IDFA not shared)
- 2 – Denied – The user chose via ATT to not be tracked by the app (IDFA not shared)
- 3 – Authorized – The user chose via ATT to allow tracking (IDFA shared)
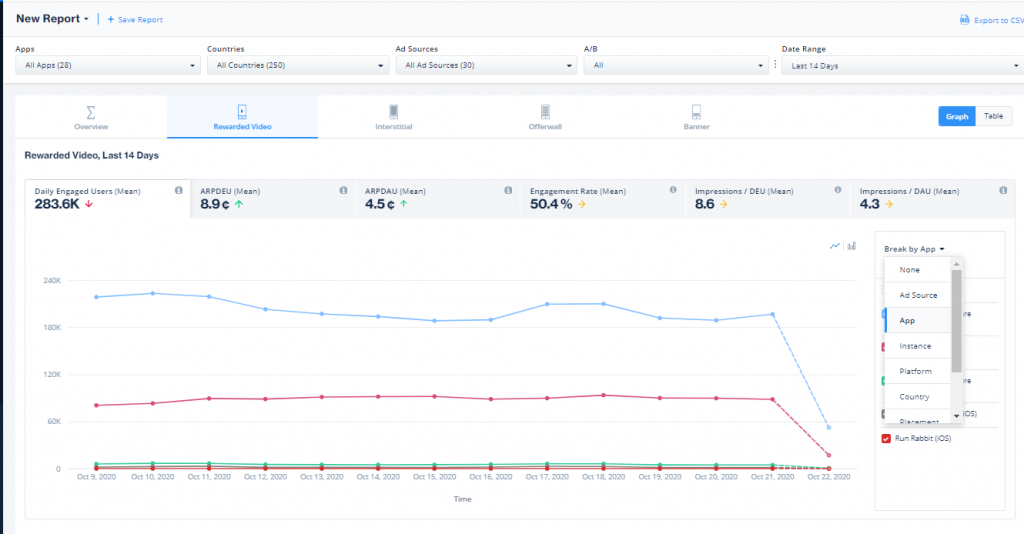
Ad unit specific tabs
Each ad unit specific tab (RV,Interstitial, Offerwall, and Banner) has an identical format consisting of the following breakdowns:
- DEU – Number of users engaging with that type of ad on a given day
- ARPDEU – Average daily revenue generated from each engaged user
- ARPDAU – Average daily revenue generated from each user, regardless of engagement
- Engagement Rate – Percent of users engaging with this ad type per day
- Impressions/DEU – Average Impressions per engaged user per given day
- Impressions/DAU – Average Impressions per user per given day
In the Offerwall tab, you’ll see data for both your ironSource and Tapjoy offerwall as one data set. Break the data by Ad Source to view them separately.
Important!
If your app isn’t monetizing with rewarded videos or interstitial ads on the Tapjoy network through LevelPlay:
- Activate the Tapjoy network
- Add your Tapjoy SDK Key to the App Settings
Learn how
Additional breakdowns
In each Ad Unit tab, you can use the same breakdowns as in the Overview, as well as the following:
- Segment – For example, by geo or payer vs non-payer if segments were defined
- Placement – Data based on a specific location of an ad in the game (Home screen vs Out of Lives, etc.)
- Instance – Data per instance, per network
When to use User Activity Reports
Trend analysis
For mediation partners, the User Activity Report can be used to identify performance trends.
- Long Term Trends – valuable for QBRs, internal reviews, setting goals
- Show increase/decrease in DAU
- Increase/decrease in user value, drops in ARPDAU and ARPDEU
- Seasonality trends
- Short Term Trends – identify spikes or drops in numbers
- Impact on DAU from an App Store feature
- Immediate impact of adding or removing ad placements, or changing ad frequency and/or capping
Monetization strategy implementation review
When analyzing the account and comparing to similar titles, the User Activity Report offers a quick snapshot that can be used to compare a title to competitors.
- High level ARPDAU comparison
- Review how your title compares to similar titles. If ARPDAU is lower than benchmarks, we may need to dive specifically into what is causing lower than optimal performance. For example, are you missing an ad unit entirely? Is the geo mix different from most similar titles?
- Ad unit specific comparisons
- Engagement Rate – Is this above or below the benchmark?
- Usage Rate – Is this above or below the benchmark?
A/B Testing
Use the Monetization strategy implementation review to recommend tests to bring these metrics inline with benchmarks.
- Is engagement too high/low? Is usage rate too high/low?
- A/B test strategies to bring metrics in line with benchmarks and review the impact on ARPDAU
Report formats
You can view your reports in two different formats: Graph and Table.
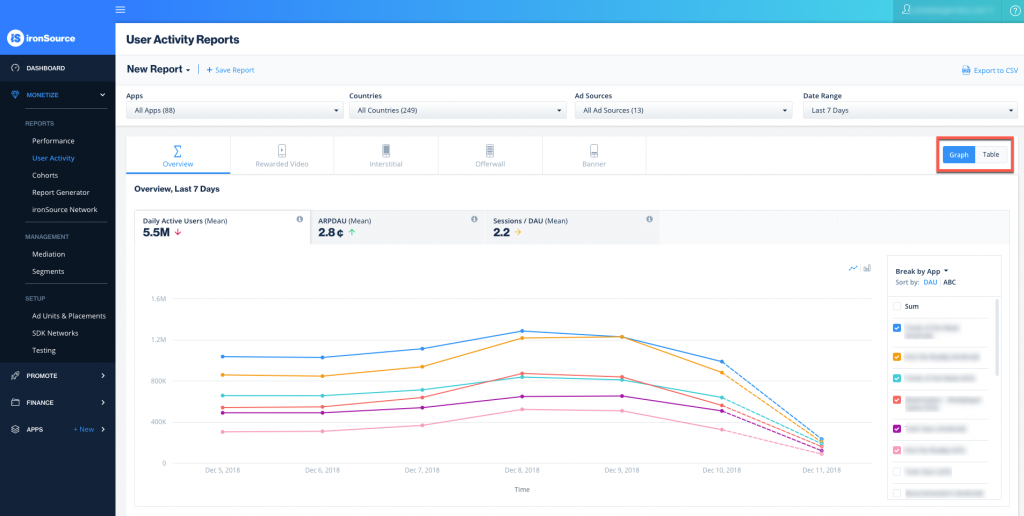
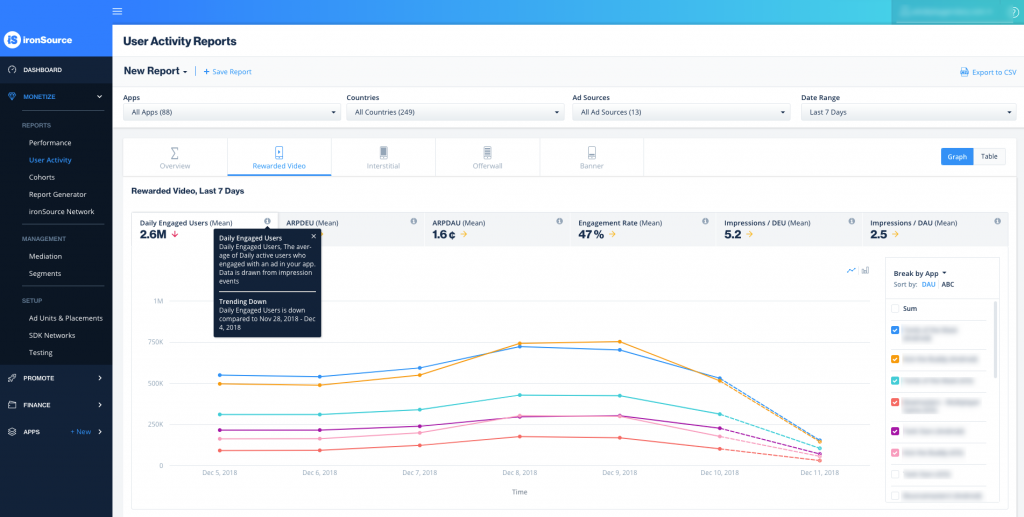
Graph
The Graph format shows patterns of your data based on the defined breakdowns and filters. You can track your performance in a visual format, which makes it easy to understand trends and provides a nice view of the data over time, as a whole.
The Metric Totals in Table, below the graph, provides you with a summary of the metrics portrayed in your report in table format. The numbers in the table are a total of each metric, i.e. the total DEU, ARPDEU, ARPDAU and Engagement Rate. The table reflects the identical breakdowns and filters defined for the graph.
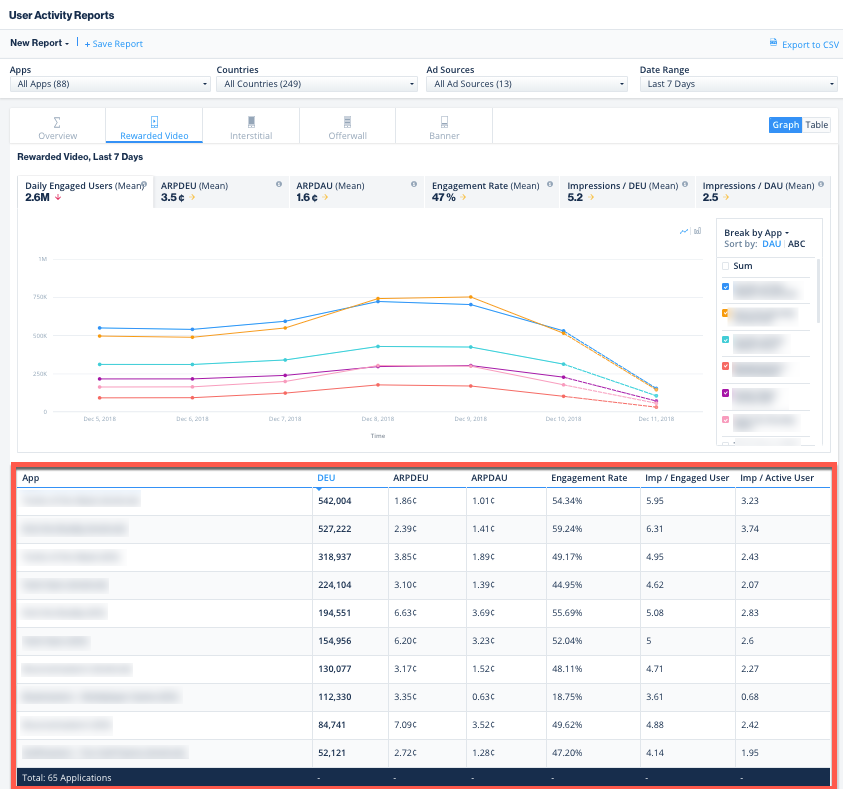
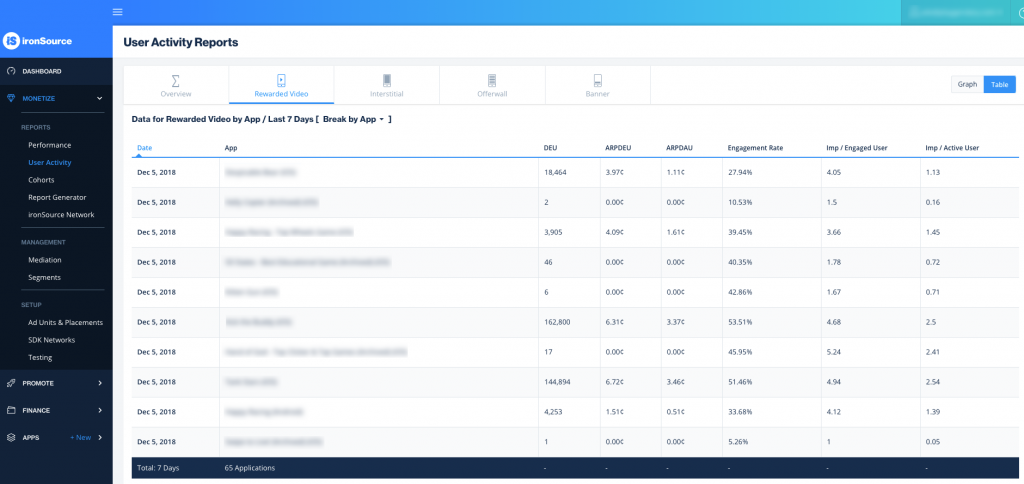
Table
The Table format presents your data in columns and rows based on the defined breakdowns and filters. You can see exact values alongside dates, which makes it easy to compare individual numbers. This format is recommended when you want to understand or compare specific parts of your performance.
- Click on the headers to reverse the order of the data (eg., clicking on Date will reverse the order from chronological to reverse chronological)
- You can extend the bottom of the table up to 500 rows
- The report data totals are visible in the last row
-
Browse Your Metrics
Unique user-based metrics on the Monetization Reports are supported on SDK 6.3.0+ for Android and 6.3.2+ for iOS.
Supported metrics on the User Activity Reports dashboard
ironSource provides deep insights into your app’s ad performance with a wide range of unique user metrics. These advanced metrics help you understand how your users interact with your app and the ads you serve; allowing for better implementation and control.
Revenue-based metrics are supported for every breakdown.
DEU – Daily Engaged Users, the average of daily active users who engaged with an ad in your app. Data is drawn from impression events.
ARPDEU – Average Revenue per Engaged User, the total revenue divided by the total number of engaged users
ARPDAU – Average Revenue per Daily Active User, the total revenue divided by the total number of active users
Engagement Rate – The total number of engaged users divided by the total number of active users
Impressions/DEU – Impressions per Engaged User, the total of impressions divided by the total number of engaged users
Impressions/DAU – Impressions per Active User, the total of impressions divided by the total number of active users
Click on each metric to see a dedicated graph. Click on the metric’s tooltip to see current trend details.
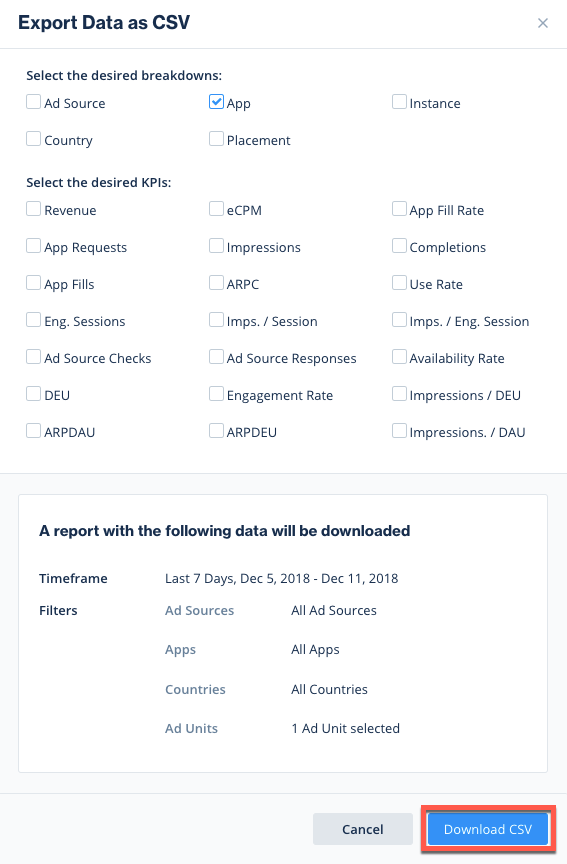
Export Your Data
If you’d like to export a report to save it as an external file, click on Export to CSV
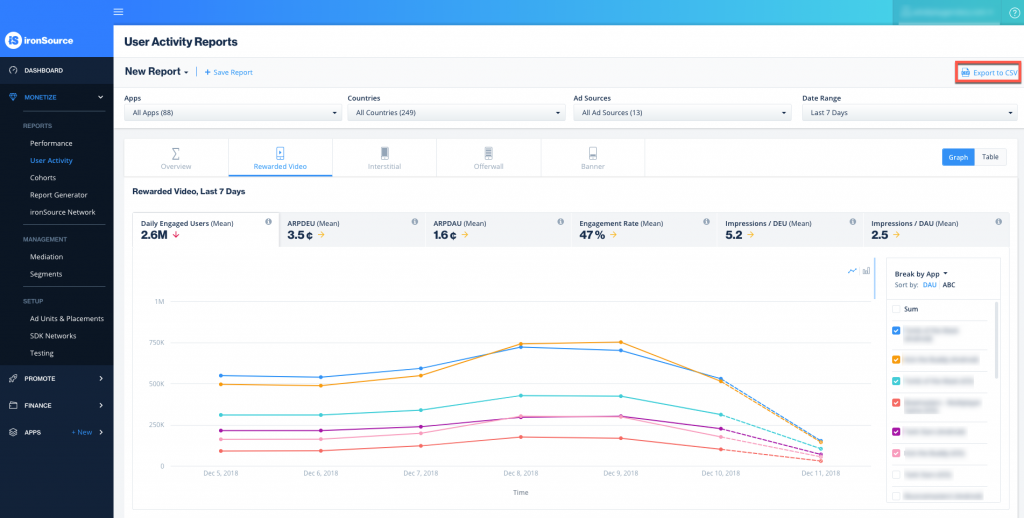
The following window will open so you can verify your breakdowns and metrics (these include performance metrics). Make sure the date range is correct. Click Download CSV and the file will download to your computer.