Mediation Reports
Supersonic supports Video and Interstitial Ads as part of our Mediation platform. Gain valuable insights on your applications performance and take effective decisions by utilizing our build in Reporting module. The below guide provides instruction on how to utilize our Reporting module for maximum success.
Unique User-based Metrics on the Monetization Reports are supported on SDK 6.3.0+ for Android and 6.3.2+ for iOS.
Step 1. Navigate to the Mediation Reports Page
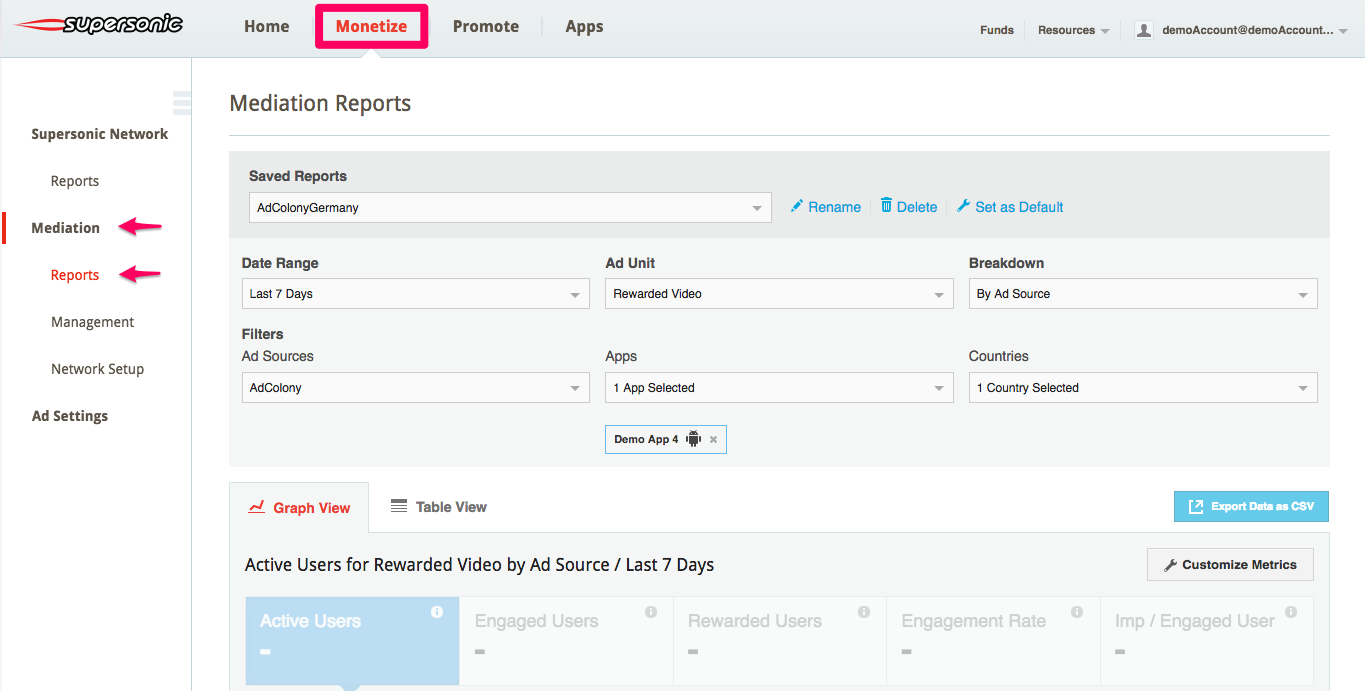
Once you log in to your Supersonic account, go to ‘Monetize‘ ➣ ‘Mediation‘ ➣ ‘Reports‘.
Step 2. Configure Your Report
If you have saved reports in the past, you will be able to view them under Saved Reports.
Then you will be able to configure your report with the below components:
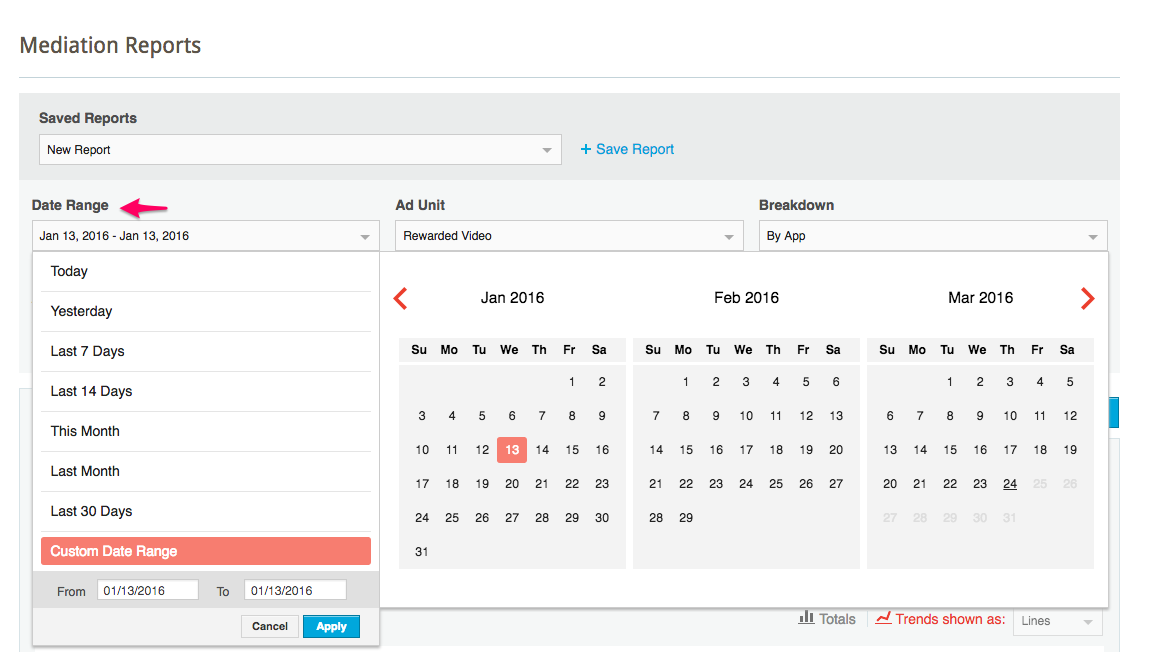
- Date Range: You will be able to choose predefined dates such as ‘Last 7 Days’, ‘This Month’, ‘Last 30 Days’, etc. or you can insert a custom date range.
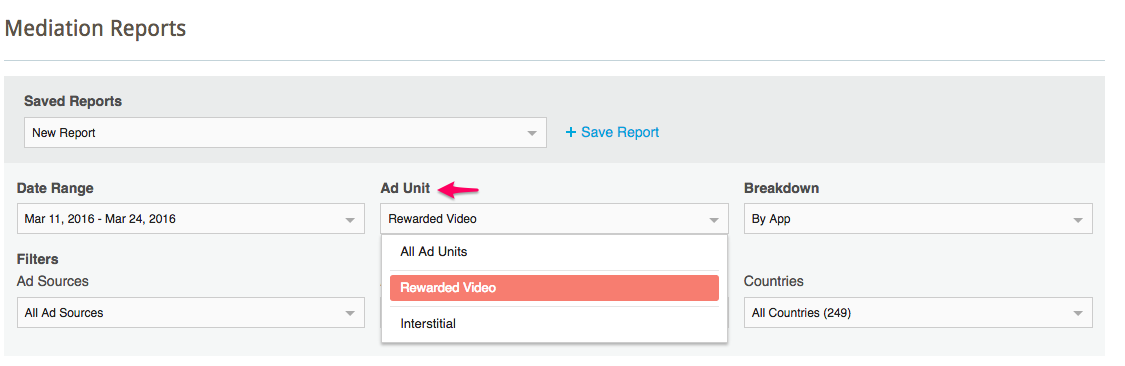
- Ad Unit: Specify if you’d like to see reports on Rewarded Video or Interstitials respectively, or simply select ‘All Ad Units’.
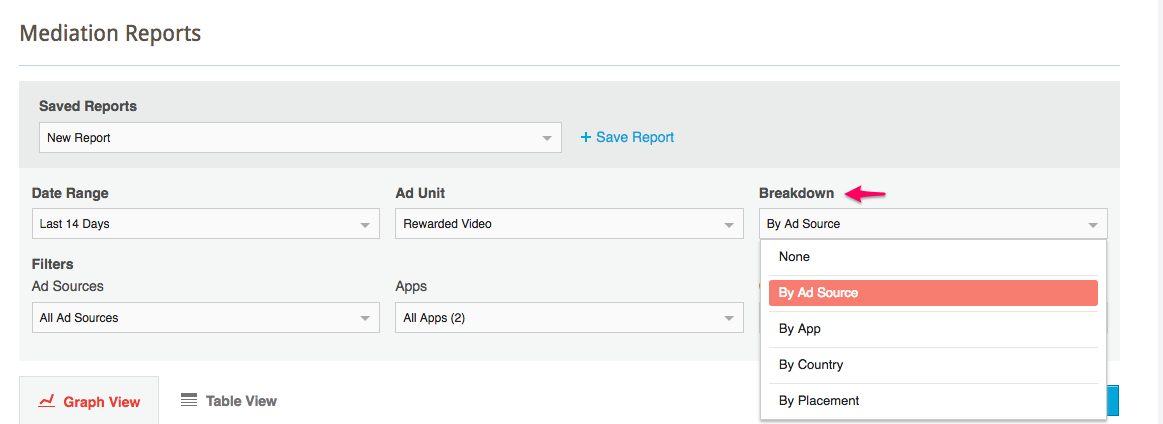
- Breakdown: Classify the report by Ad Source, App, Country or Placement.
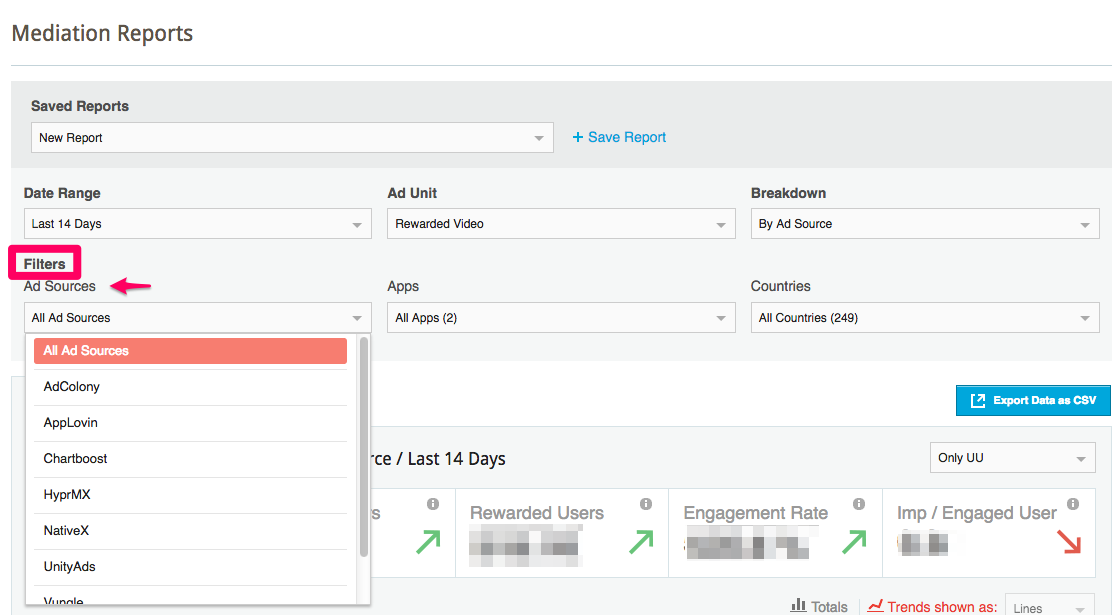
- Filters- You can refine the reports with the following filters:
- Ad Sources: Set up the report to focus on one particular ad source or view all of them:
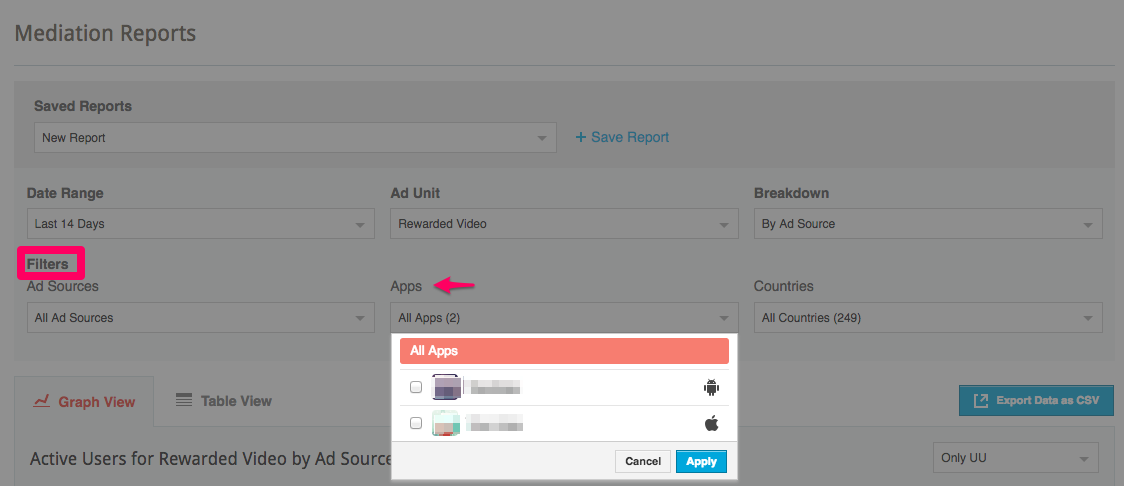
- Apps: Set up the report to focus on one, several or all apps.
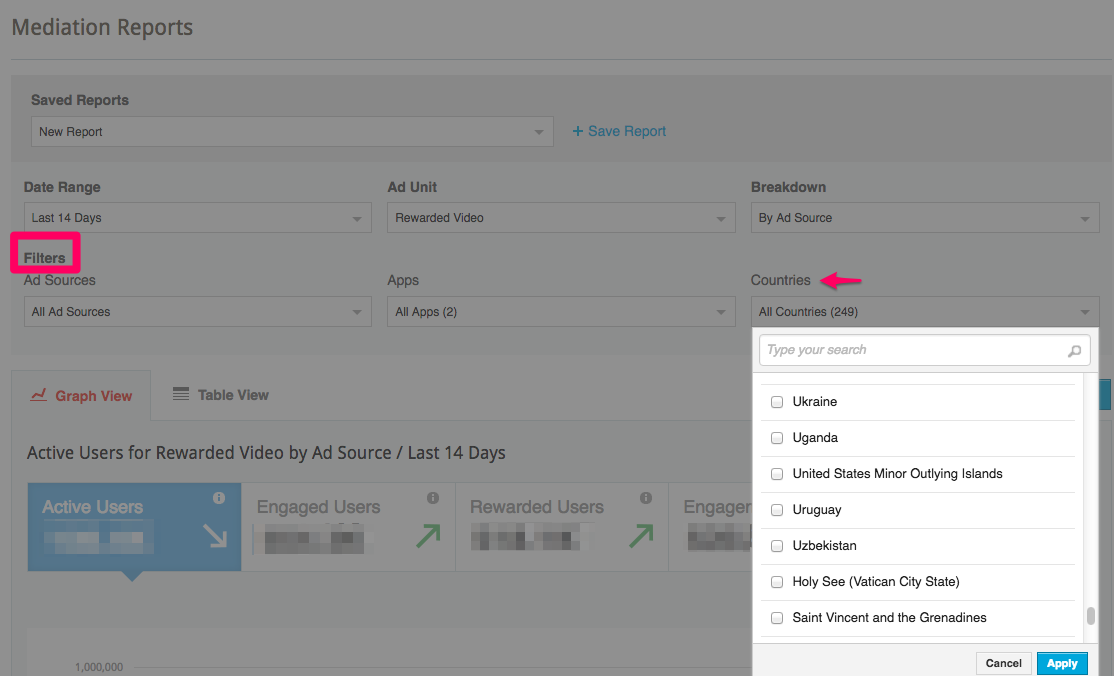
- Countries: Set up the report for selected countries.
- Ad Sources: Set up the report to focus on one particular ad source or view all of them:
Step 3. Define Your Metrics
Once you’ve adjusted the components that form your report, you can define the metric set to measure your ad performance.
New! Customize Your Metric Set with Unique User-based Data
You can now customize your metric set and save them for the future. Additionally, you can now incorporate unique user-data in your revenue, eCPM, Fill Rate, Requests and Impressions to see how your performance is affected.
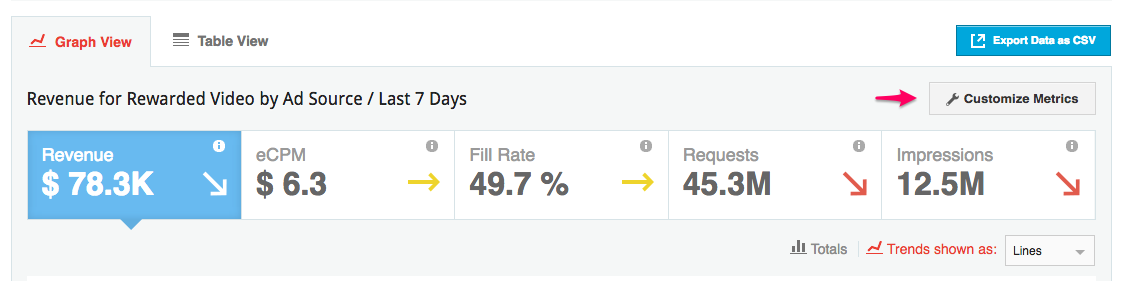
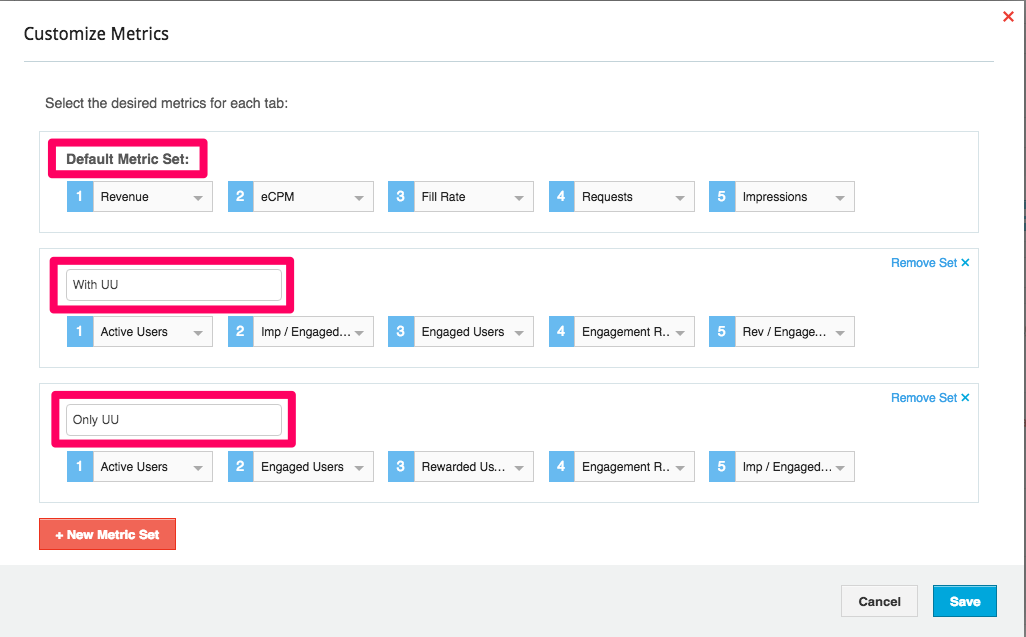
Define your metric set by clicking on the ‘Customize Metric‘ button above the reporting module:
 You will be able to select ‘Default Metric Set‘, ‘With UU‘ (Unique User-based Data) and ‘Only UU‘ at first, but can choose to remove a Metric Set or add a ‘New Metric Set‘.
New! Unique User-based Data as Key Performance Indicators (KPIs)
You can now view your ad performance based on unique user-based data! These advanced metrics give you deeper insights on how your users interact with your app and the ads you serve; allowing for better implementation and control.
The new metric set is comprised of:
Revenue: Total amount of revenue generated
eCPM: Effective cost per thousand impressions. Calculation: revenue divided by impressions multiplied by 1000
Fill Rate: The rate at which ad delivery is completely following a request. Calculation: ad fullfilmet divided by requests multiplied by 100%
Requests: Number of times an ad request has been conveyed. The request numbers for individual ad networks will differ if/when breaking down or filtering by ad source.
Impressions: Total number of impressions
New! Active Users: number of unique users who opened your apps
New! Engaged Users: number of unique users who engaged with an ad on your apps. Data drawn from impression events.
New! Rewarded Users: number of unique users awarded a reward with Rewarded Video Ads. Data drawn for Granted Reward events.
New! Engagement Rate: Total of engaged users divided by total of active users.
New! Impressions per Engaged User: Total of impression event divided by total of engaged users.
New! Revenue per Engaged User: Total Revenue divided by total of engaged users.
Step 4. Review Data
- Browse between the metrics by clicking on them. The graph will change according to the selected metric; for example, when selecting ‘Rewarded Users‘, the graph will portray the data for this specific metric.
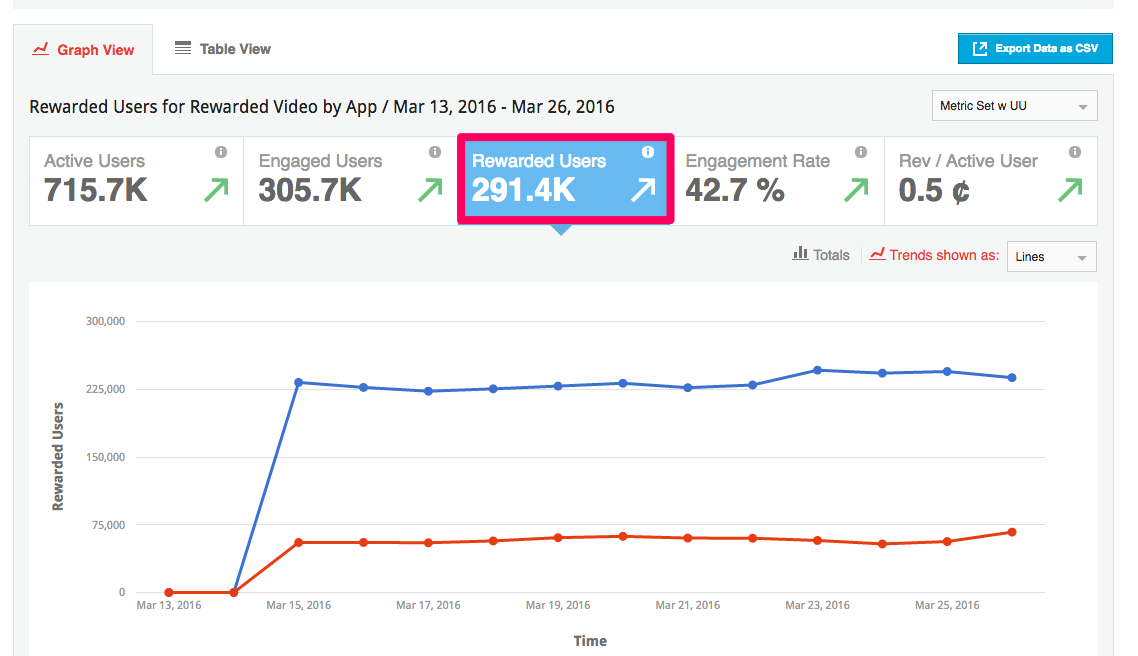 Note: Note: Unique user-based metrics are calculated on the mediation level (not affected by ad source filter or breakdown).
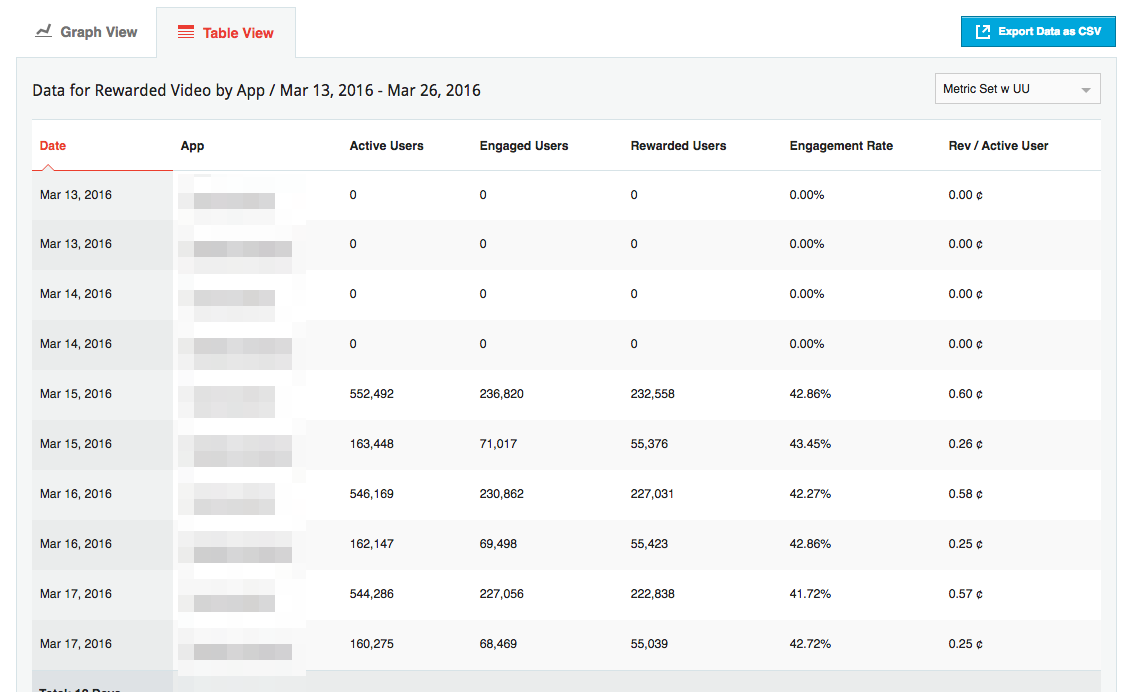
 - Download your mediation reports by clicking on ‘Export Data as CSV‘ on the top right corner of the report module:
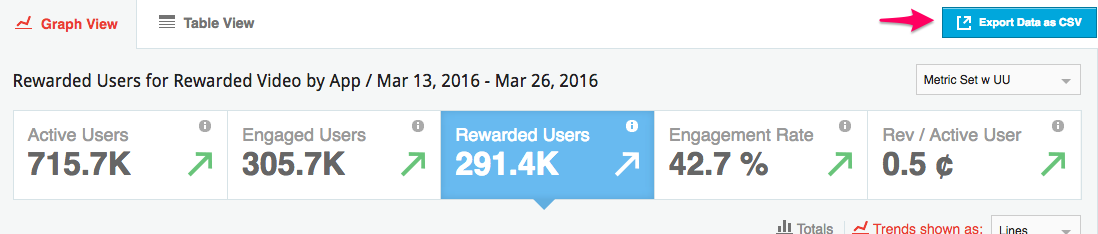
- View the report in table mode by clicking on ‘Table View‘: